10/03/2023

SELL SIGNAL : TRADE BELOW RESISTANCE LINE

Click on Image to ZOOM


In above pic Green Line is placed Manually, rest of the thing is automatically drawn by TspFinderPro Mt4 Indicator.

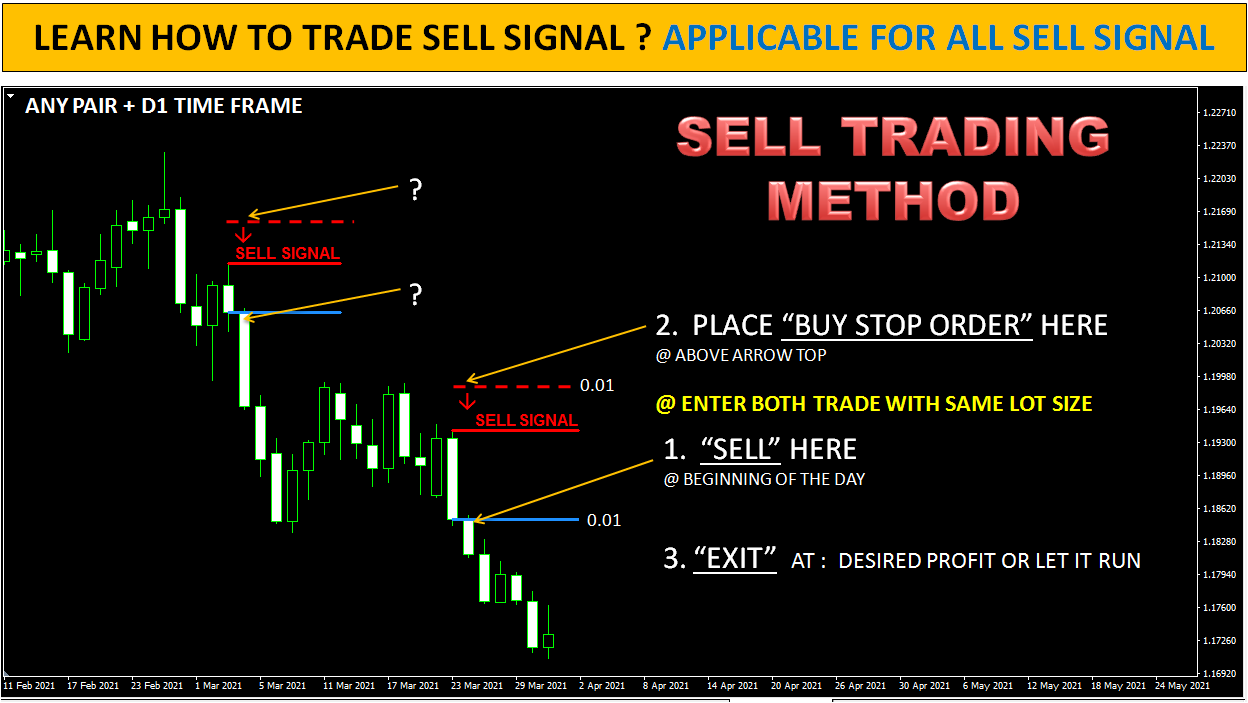
How to confirm and trade Sell Signals generated by Tsp Finder Pro.

Before you jump into any trade you must know the Support and Resistance area or previous trend. This will help you to choose right side of the market trend and its reversal levels. without knowing S/R you will make mistake and will be trapped by institutional/professional traders and will make a loss!!

In above pic we have taken Sell Signal examples...

The GREEN LINE is our Resistance Level for New Sell Signals. Once Resistance Line is broken, then price may retest this level and starts going downside. So, our New Sell Signal must be below the Resistance Line. Once you get New Sell Signal below the Resistance Line, you can easily trade that signal without practicing any more technical analysis.

In above pic, there is 8 New Sell Signals generated below the Resistance Line and almost all of them jumped toward downside. This way you can trade all Sell Signals comes below Resistance Line!!

In my Course : Signal 2 Signal, I will teach you how to find and draw right support area for Sell signals in details, along with that you will also learn which Sell Signals are more profitable with low risk.

Trading with TSP FINDER PRO Indicator is very easy and It's Profitable too.

If you are interested to check my TSP FINDER PRO's signal accuracy, request your demo version now.


You can also connect with me directly to + 91 93281 32758,

If any further assistance needed.

Check more signal on my Facebook Wall : Click Here


BUY SIGNAL : TRADE ABOVE SUPPORT LINE

 Click on Image to ZOOM 


In above pic Green Line is placed Manually, rest of the thing is automatically drawn by TspFinderPro Mt4 Indicator.

How to confirm and trade Buy Signals generated by Tsp Finder Pro.

Before you jump into any trade you must know the Support and Resistance area or previous trend. This will help you to choose right side of the market trend and its reversal levels. without knowing S/R you will make mistake and will be trapped by institutional/professional traders and will make a loss!!

In above pic we have taken Buy Signal examples...

The GREEN LINE is our Support Level for New Buy Signals. Once Support Line is broken, then price may retest this level and starts going upside. So, our New Buy Signal must be above the support line. Once you get New Buy Signal above the Support Line, you can easily trade that signal without practicing any more technical analysis.

In above pic, there is 9 New Buy Signals generated above the Support Line and almost all of them jumped toward upside. This way you can trade all Buy Signals comes above SUPPORT LINE!!

In my Course : Signal 2 Signal, I will teach you how to find and draw right support area for Buy signals in details, along with that you will also learn which Buy Signals are more profitable with low risk.

Trading with TSP FINDER PRO Indicator is very easy and It's Profitable too.

If you are interested to check my TSP FINDER PRO's signal accuracy, request your demo version now.


You can also connect with me directly to + 91 93281 32758,

If any further assistance needed.

Check more signal on my Facebook Wall : Click Here


01/03/2023

TSP FINDER PRO'S - SELL PROFITABLE TRADES VS SELL HEDGED TRADE


Click On Image to Zoom...


Tsp Finder Pro - Indicator generates profitable trading signal based on real time price action data. You can see above image, on GBPCAD chart - indicator have generated total 7 profitable trades signals back to back, without touching stop loss order area, and last 1 trade hits SL order, and it hedged.

So, when trade is hedged we need for cover that trade's loss by applying any 1 of 3 strategy, specially developed for buy hedged positions.

I will teach all 3 strategy in my "SIGNAL 2 SIGNAL" COURSE. By using any of these strategy you can easily counter any hedged position without losing from your account.


To request trial/demo, and want to see how TSP FINDER PRO generates profitable trading signals on different markets you trade. Please send request by clicking below image.


TSP FINDER PRO'S - BUY PROFITABLE TRADES VS BUY HEDGED TRADE


Click On Image to Zoom...


Tsp Finder Pro - Indicator generates profitable trading signal based on real time price action data. You can see above image, on AUDUSD chart - indicator have generated total 8 profitable trades signals back to back, without touching stop loss order area, and last 1 trade hits SL order, and it hedged.

So, when trade is hedged we need for cover that trade's loss by applying any 1 of 3 strategy, specially developed for buy hedged positions.

I will teach all 3 strategy in my "SIGNAL 2 SIGNAL" COURSE. By using any of these strategy you can easily counter any hedged position without losing from your account.


To request trial/demo, and want to see how TSP FINDER PRO generates profitable trading signals on different markets you trade. Please send request by clicking below image.


31/01/2023

LESSON : WHERE TO TAKE ENTRY AND PUT STOP LOSS ORDER FOR BUY & SELL SIGNALS


When you start trading with TSP FINDER PRO Indicator, you will get Buy & Sell signal trading opportunity. Whenever indicator alert you Buy or Sell signal, enter trade as shown in above image.

 Applicable for all Sell & Buy Signals generated by Tsp Finder Pro.


21/01/2023

Tsp Finder Pro Installation & Mt4 Chart Preparation Guide


1. Let's prepare your Meta Trader 4 platform chart first.

- Open MT4 and Download Maximum data of D1 time frame for all pairs.


2. Installation Tsp_Finder_Pro Indicator on your MT4 Trading Platform.

- Copy - paste :  < Tsp_Finder_Pro Indicator > File to // MT4 INDICATOR FOLDER

- Close MT4 & Open again...


3. Prepare your chart... For Signal.

- Open EURUSD chart, load < Tsp_Finder_Pro Indicator > File on chart. You will see the signal on your chart.


How to Back-Test Tsp Finder Pro ? Right Way...


What is the meaning of backtesting? 

What Is Backtesting? Backtesting is the general method for seeing how well a strategy or model would have done ex-post. Backtesting assesses the viability of a trading strategy by discovering how it would play out using historical data.

***

Very first load TSP FINDER PRO Indicator on EURUSD chart, & pick any latest signal, apply Buy-Sell trading method for that signal.

Now check price crossing or touched bottom of the arrow (For buy signal), top of the arrow (For sell signal), if not then this will be counted as a win trade and if yes then this will be counted as a loosing trade.

Check another signal and see what happened to that signal, win or loose ?
Keep doing it and note all the signal you backtest.

- Keep applying Buy-Sell trading method for all buy-sell signal for that pair.
- Load another pair and repeat the process...

Your primary job is to find, how many signal "hits stop loss", & how many wins. Count total wins & loss trade on notepad, to get final idea about the signal win rate.


RIGHT WAY TO BACK TEST TSP FINDER PRO INDICATOR IS TO

Back-test "Tsp Finder Pro signal" Month wise.

Example : Load Tsp Finder Pro on EUR USD pair.

- Now, apply buy-sell trading method, on all signals for the month of  JAN-2023 only.
- Write total win and loss trades for this month for Eur usd pair.
- Load new pair, and check JAN-2023 signals.
- Keep record for that month's signal, how many trades you lost and win !!
- Once you complete "JAN-2023" month, test on another month you like.
- Dare to test all pair you want to trade!!
-
 Keep Chart Grid Lines OFF  : Click on chart anywhere and Press  <Ctrl + G>


How many trades is good for a backtest?

The bigger the sample is the smaller the margin of error, but usually a sample of 200 trades should be sufficient. If your trading system generates enough trades, then you should use 200 – 400 trades.


PRACTICE !! PRACTICE !! & PRACTICE !! TO MASTER THE TRADING SIGNALS.